
How to monitor errors in a browser extension in production
Extensions fail in ways web apps do not: a stopped service worker, a revoked permission, an API that one browser does not have. What breaks, how to capture errors without collecting your users' browsing, and how to tell whether a release made things worse.
Updated November 20, 2026 · 5 min read · Markdown version
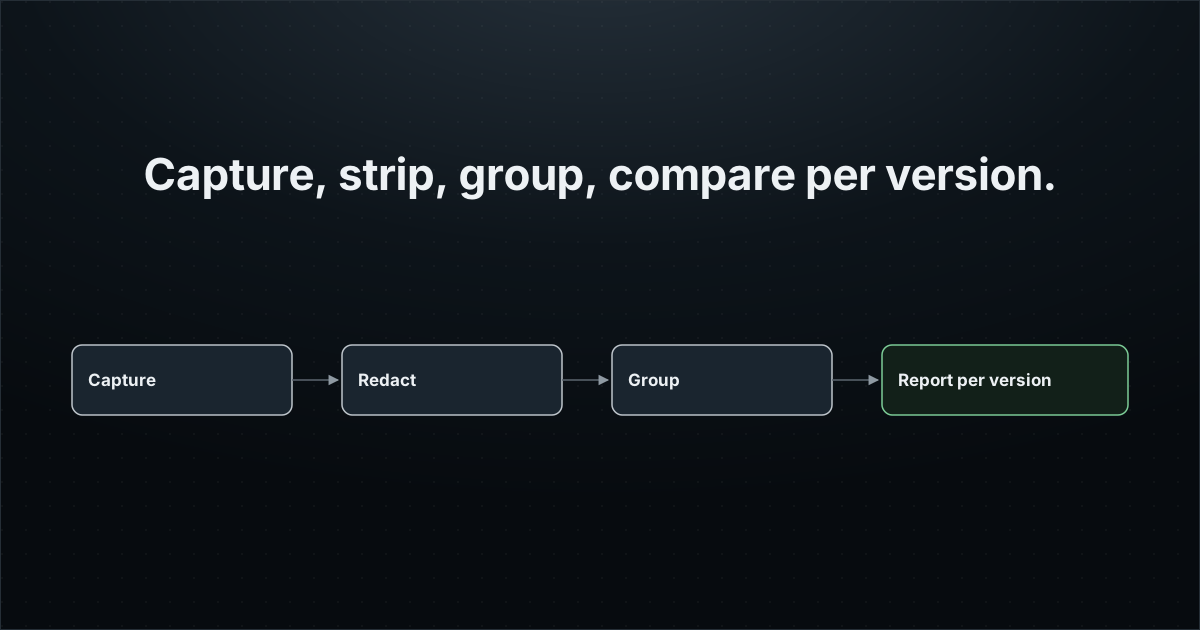
A user leaves a one-star review: "stopped working". You cannot reproduce it. The extension runs in thousands of browsers you will never see, on sites you have never visited, in versions of Chrome, Edge and Firefox that each behave a little differently.
This guide lists what actually breaks in production extensions, shows how to capture errors from every context without sending the pages your users visit, and how to compare one release with the previous one before the reviews do it for you.
What breaks in a production extension
The service worker restarts. Chrome stops it after 30 seconds of inactivity, after 5 minutes on a single event, or when a fetch() response takes more than 30 seconds. Every global variable is reset. Code that assumed a value set at startup, a cached token or an open connection, now reads undefined.
Permissions change under you. Optional permissions can be removed, and chrome.permissions.onRemoved fires when they are. On Chrome, users can also restrict the sites an extension may run on. Code that worked yesterday on a host now fails, with no change on your side. Check with chrome.permissions.contains() before relying on one.
An API exists in one browser only. The same extension package runs on Chrome, Edge and Firefox, but their APIs differ:
| API | Chrome | Edge | Firefox | Safari |
|---|---|---|---|---|
sidePanel | 114+ | Yes | No | No |
sidebarAction | No | No | 54+ | No |
runtime.setUninstallURL | Yes | Yes | Yes | Exists, no effect |
Call chrome.sidePanel.open() on Firefox and you get TypeError: Cannot read properties of undefined. Your tests on Chrome were all green.
Old versions keep running. Chrome checks for updates on startup and every few hours, and installs an update only when the extension is idle. A fix you published this morning can take a while to reach everyone, so errors from the previous version keep arriving after the release.
Capture errors from every context
An extension is several programs: the service worker, one content script per tab, the popup, the options page, the side panel. Each needs its error handlers, and each must hand its errors to one place.
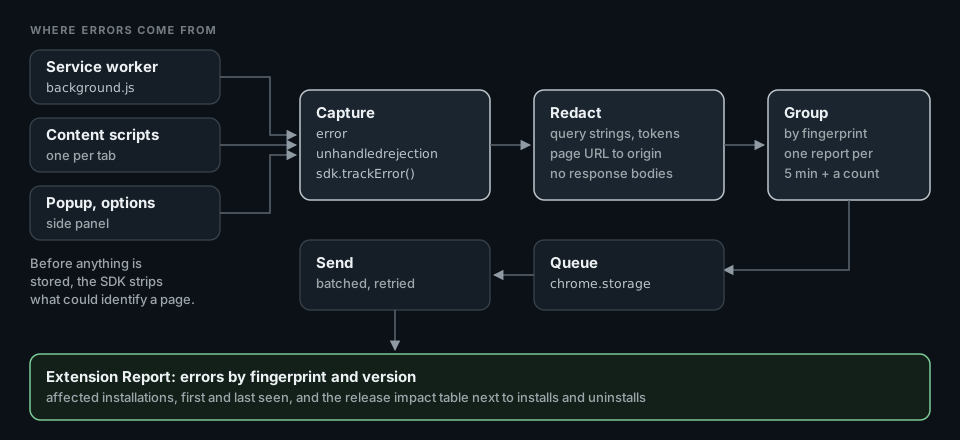
With the Extension Report SDK, reliability: "errors" installs the global error and unhandledrejection handlers in the background. Add trackError where you catch an error on purpose and still want to know about it:
// background.ts
import { initExtensionReport } from "@extension-report/js";

export const sdk = initExtensionReport({
  projectPublicKey: "pk_er_...",
  instrumentation: { reliability: "errors" }, // "full" also correlates failed fetch() calls
});

async function syncSettings() {
  try {
    await pushSettingsToServer();
  } catch (error) {
    await sdk.trackError(error); // handled, but you still want the count
    throw error;
  }
}
For a browser-specific API, detect it first and record the fallback. That turns a crash into a measured decision:
async function openReader(tab: chrome.tabs.Tab) {
  if (chrome.sidePanel?.open && tab.windowId !== undefined) {
    await chrome.sidePanel.open({ windowId: tab.windowId });
    return;
  }
  // Firefox and Safari: no sidePanel API. Open the same page in a tab.
  await chrome.tabs.create({ url: chrome.runtime.getURL("reader.html") });
  await sdk.trackCustomEvent("reader_opened_in_tab", { reason: "no_side_panel" });
}
On Chrome, sidePanel.open() exists from Chrome 116 and may only be called in response to a user action. Call it from the click handler, not after an unrelated await.
Capture without collecting your users' browsing
An error in a content script carries the page it happened on. A failed request carries its URL, often with a session token in the query string. Sent as is, your error tracker becomes a log of what your users read. Chrome's own GA4 tutorial warns that stack traces can contain personal data and should be cleaned before sending.
What the Extension Report SDK does by default, before anything is stored:
- URLs in messages and stacks lose their query string, hash and credentials.
- A content script error keeps only the origin of the visited page, not its path.
- Keys and values that look like secrets (
token,password,api_key,authorization...) are replaced by[redacted]. - Response bodies are not read. Messages are cut at 500 characters, stacks at 4,000.
- The same error repeating is reported once per five minutes with an occurrence count, with full detail at most once a day.
You can widen any of these with instrumentation.errorDiagnostics when your privacy policy and store disclosure cover it, or drop events entirely with beforeSend:
export const sdk = initExtensionReport({
  projectPublicKey: "pk_er_...",
  // Synchronous: return null to discard an event before it is stored.
  beforeSend: (event) =>
    event.name === "sdk_error" && event.attributes?.where === "content_script" ? null : event,
});Release health: did this version make things worse?
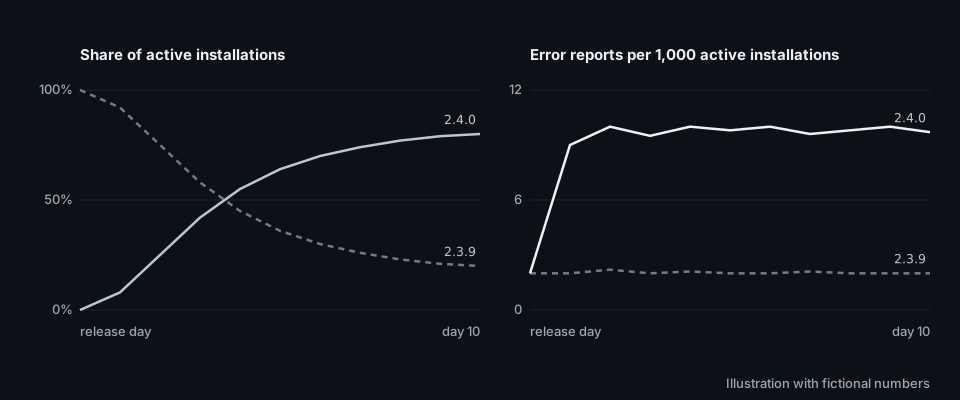
A raw error count rises when you gain users and falls when they update. The useful question is narrower: for the installations running version N, compared with N-1, are there more errors, and more uninstalls?
- Errors are grouped by fingerprint: the context, the error name, the message and the source location.
- Each group shows the versions it affects and when it was first and last seen.
- The Releases screen lists, for each version, its share of active installations, its update lag, installs, uninstalls, 7-day retention and the installations that reported an error.
- From your coding agent, the MCP tools
query_errors,get_error_occurrencesandget_release_healthanswer the same questions in a conversation.
If you already use Sentry
Sentry is a strong error tracker and works in extensions with care. Its documentation for shared environments, which names browser extensions, says not to call Sentry.init() there: it pollutes global state, and errors can cross between your project and the website's own Sentry. Instead you create a BrowserClient and a Scope by hand and remove the integrations that use global state.
Extension Report and Sentry do not exclude each other. Extension Report adds what an error tracker does not know: installs, active installations per version, uninstalls and their reasons, so an error rate has a denominator.
Do it with your AI agent
Let your agent set it up while you read the next guide.
Paste the request below into Claude Code, Codex or Cursor. Your agent connects to Extension Report through MCP, creates your account and the project, installs the SDK in your code and checks that events arrive. You sign in once and approve access. Extension Report never sees your code: the agent edits it on your machine.
1. Connect https://mcp.extension.report
claude mcp add --transport http extension-report https://mcp.extension.report
codex mcp add extension-report --url https://mcp.extension.report
2. Ask your agent
Add Extension Report error monitoring to this extension, with trackError in the important catch blocks. Follow https://extension.report/docs/agents.txt.
The full playbook your agent follows: /docs/agents.
Prefer to do it yourself?
Free plan: 1 extension, 1,000 monthly active users, 30-day history.
Sources
- Chrome for Developers: The extension service worker lifecycle
- Chrome for Developers: chrome.permissions
- Chrome for Developers: User controls for host permissions
- Chrome for Developers: chrome.sidePanel
- Chrome for Developers: The extension update lifecycle
- MDN browser compatibility data: sidePanel, sidebarAction, runtime
- Chrome for Developers: Use Google Analytics 4 in an extension (personal data in stack traces)
- Sentry: Using Sentry in shared environments